Recently a client asked me to recommend some websites for investment research. I do a lot of investment research so I have a slew of resources but I wanted to provide my client with easy-to-use, free research websites. The following three free websites provide objective information to help you evaluate stocks, bonds, exchanged traded funds, mutual funds, and closed-end funds. While all are free to use, some have a paid subscription option for more advanced features but even this option is offered as a free trial version.
3 Free Sites for Intelligent Investment Research
1 )Yahoo Finance
The Yahoo Finance website is a good source of current and historical security prices, price charts, company information, financial statements and more. Add your current portfolio or a target portfolio into “My Portfolio” to quickly track price changes, read news about the company, and review options prices.

2) Morningstar
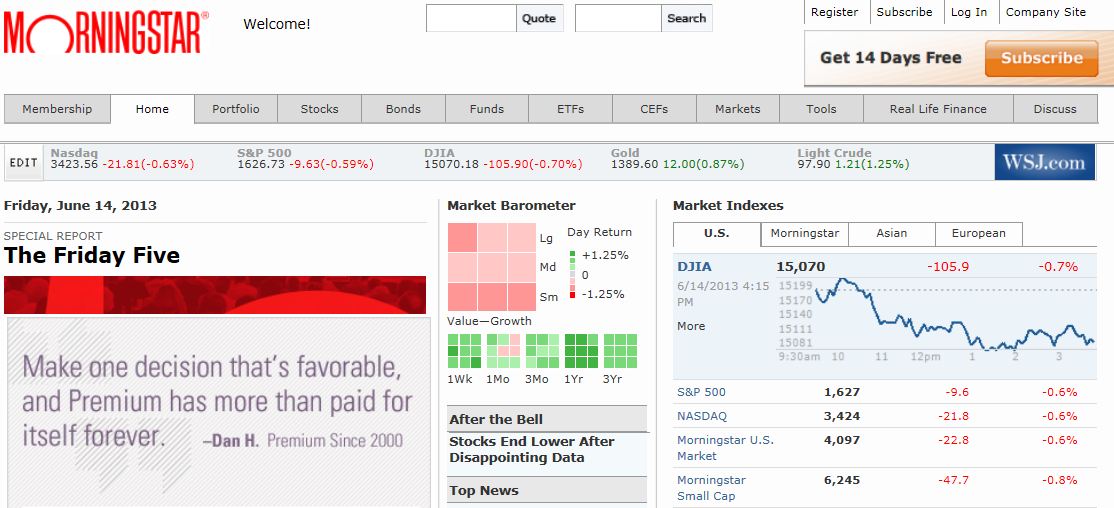
morningstar.com (FREE basic or annual subscription for more in-depth information)
If you like information in picture format you’ll like Morningstar’s style boxes. The 9-box matrix separates stocks into size and style categories. Large, medium and small cap stocks are on the vertical axis. Along the horizontal axis stocks are grouped by value, core, and growth styles. Below you can see that on Friday, June 14, the worst performing segments, those in the darkest red, were large value and all small cap stocks. This site offers free investment research data on individual securities, exchange traded funds, mutual funds, and closed-end funds. If you want more than the basic information, try the 14 day free trial to see what a subscription has to offer.
3) Stockcharts.com
www.stockcharts.com (FREE basic or annual subscription for greater charter capability)
If you’re interested in technical indicators, they can be found at StockCharts.com. You can watch 20, 50, 200 day moving averages, Bollinger Bands to help identify when a price hits its support or ceiling, and much more all for free. If you need more advanced capabilities, you might be interested in a 10 day free trial.

All three websites are good sources of financial information that can be tapped to make smarter investing choices. Now when a friend shares a ‘hot stock tip’ you can verify just how good it is by doing your own research.
If you enjoyed this post, please share it with a friend! Have questions or comments about this post? Leave a comment.